Home Blog Page 13

Crafting Snippet-Worthy Content: Your Guide to AI Overview Optimization in India.

 Introduction

Search engines are rapidly evolving, and with them, the rules of digital visibility are being rewritten. The rise of AI overviews—short, AI-generated summaries that appear directly in search results—has changed how users interact with online content. In India, where mobile-first browsing, voice search, and regional language usage are widespread, this evolution holds particular significance.

If you’re a content creator, marketer, or business owner in India, it’s no longer enough to simply rank in the top 10 search results. To truly stand out, your content must be optimized to appear in AI-generated summaries or snippets—the new prime real estate in search.

This comprehensive guide will explore how to craft snippet-worthy content specifically tailored to the Indian digital landscape. We’ll cover the importance of AI overviews, the anatomy of snippet-optimized content, strategic approaches to increase your chances of being featured, and a real-world example to bring it all together.


What Are AI Overviews and Why Do They Matter?

AI overviews (also referred to as AI snapshots or summaries) are brief, direct responses to search queries generated by large language models (LLMs). These answers are pulled from multiple online sources and presented above traditional search results. The purpose? To give users instant answers without needing to click on a link.

In India, where more than 750 million internet users are expected by 2025, many of whom rely on mobile data and voice search in regional languages, these summaries are becoming increasingly influential.

Why this matters for Indian content creators:

  • High competition in niches like ed-tech, e-commerce, and fintech.
  • Users in India are increasingly relying on Google, Bing, and tools like ChatGPT or voice assistants for quick information.
  • AI-generated snippets are reducing click-through rates on traditional listings.

If your content is not optimized for AI overviews, it risks being invisible—even if it ranks well.


Understanding Snippet-Worthy Content

Snippet-worthy content is structured, informative, and directly answers the user’s query. It anticipates the questions people ask and presents clear, concise responses in formats AI can easily interpret.

Features of Snippet-Worthy Content:

  1. Direct answers upfront (usually in the first 100 words).
  2. Structured formatting using headers, lists, tables, or bullet points.
  3. Schema markup to help search engines understand content context.
  4. Authoritativeness and clarity, often backed by references.
  5. User intent alignment, meaning the content satisfies the reader’s actual goal.

In India, the need for multilingual support and local relevance also becomes critical. AI models prioritize trustworthy content that is both contextually relevant and regionally accurate.


Step-by-Step Guide to Crafting AI-Optimized Snippet Content in India

Step 1: Know Your Audience and Their Questions

Understanding search intent is the foundation of snippet-worthy content. Use tools like:

  • Google’s “People Also Ask”
  • AnswerThePublic
  • Semrush or Ahrefs Keyword Explorer
  • Ubersuggest (especially popular in India)

For example, if you’re targeting Indian parents looking for online learning tools, they might search:

  • “Best online classes for kids in India”
  • “How to choose a CBSE online tuition platform?”

Use these queries to predict what answers AI might want to show.

Step 2: Use the Inverted Pyramid Approach

This is a journalistic style where you present the most important information first. AI prefers content that gets straight to the point.

Example:

“The best online tuition platforms for CBSE students in India include BYJU’S, Vedantu, and Toppr, based on curriculum alignment, pricing, and teacher quality.”

Follow this with deeper analysis and comparisons.

Step 3: Use Structured Data

Search engines rely on schema markup to interpret your content. Use:

  • FAQPage schema for question-answer format
  • HowTo schema for step-by-step guides
  • Product schema for e-commerce listings

Use Google’s Structured Data Markup Helper or plugins like Yoast SEO (WordPress) or Rank Math to simplify this process.

Step 4: Optimize for Voice and Mobile

In India, more than 60% of internet traffic comes from mobile devices, and voice queries are especially popular in Tier 2 and Tier 3 cities. To optimize for voice:

  • Use natural, conversational language
  • Target long-tail keywords like “What is the best health insurance for senior citizens in India?”
  • Write in simple English or Hinglish, depending on your audience

Also consider regional languages. If you’re targeting Tamil Nadu, for instance, adding a Tamil translation or summary can help with discoverability in local AI tools.

Step 5: Leverage Bullet Points, Lists, and Tables

AI loves structure.

Instead of saying:

“There are several benefits to using UPI apps in India.”

Say:

“Top benefits of using UPI apps in India:

  • Instant fund transfer
  • 24/7 availability
  • Low transaction costs
  • Easy bill payments
  • Secure two-factor authentication”

Tables are especially useful for product or price comparisons.

Step 6: Add Authority and Trust

AI prefers reliable sources. Increase credibility by:

  • Linking to government sites (like RBI.org.in or MyGov.in)
  • Citing studies or expert opinions
  • Including your author’s credentials (especially in health, finance, or legal content)

If you’re publishing on a blog about diabetes diets for Indians, add:

“Reviewed by Dr. Anjali Mehta, Clinical Dietitian, Apollo Hospitals, Mumbai”


Real-World Example: “SmartSewa” – A Digital Services Platform in India

Scenario:
SmartSewa offers digital services like PAN card application help, GST filing, and Aadhar updates, primarily targeting users in Hindi-speaking states.

Problem:

Despite ranking well for keywords like “how to update PAN card online,” their traffic was declining due to AI overviews answering the queries upfront.

Solution: Snippet Optimization Strategy

  1. Question-Based Content:
    They identified top user questions through Google Search Console and Quora:

    • “How to update PAN card online?”
    • “PAN card correction fees 2025?”
  2. Structured Format:
    Their page on PAN card updates now starts with:

    How to Update PAN Card Online in India (2025)

    1. Visit the NSDL website
    2. Select ‘PAN Correction’
    3. Fill in the form and upload documents
    4. Pay ₹96 fee
    5. Track your status using the 15-digit Acknowledgement Number
  3. Added FAQ Section with Schema:
    • “How long does PAN update take?”
    • “Can I update my PAN without Aadhar?”
  4. Brand Mentions and Citations:
    Content linked to income tax official sites and included reviews from verified users.

Results:

  • Click-through rate dropped slightly (AI was answering more questions)
  • But branded search volume increased by 22%
  • Form submissions for paid assistance rose by 31%
  • The brand started being mentioned in Bing and Google AI overviews

Bonus: Tips for Indian Content Creators

  • Localize examples: Use Indian examples (LIC policy, SBI loans, GST rates).
  • Optimize for regional searches: “Best MBA colleges in Bangalore” instead of just “best MBA colleges.”
  • Update regularly: Outdated content won’t be selected for AI snippets. Refresh stats, prices, and deadlines (e.g., last date for NEET application 2025).
  • Use Indian English spelling and grammar: Words like “favourite,” “licence,” and “enrolment” matter in local SEO nuances.

Metrics That Matter in the AI Era

Traditional SEO relied on pageviews and sessions. Now, you must track:

  • Featured snippet frequency (via tools like Semrush)
  • Zero-click impressions (via Search Console Insights)
  • Brand mention monitoring (use tools like Brand24 or Mention)
  • Conversion rates per article
  • Branded search growth

Conclusion

India’s digital ecosystem is evolving rapidly with AI overviews playing a central role in how people find information. Instead of resisting these changes, content creators and businesses must adapt by crafting snippet-worthy content — content that is concise, credible, and structured for both users and AI systems.

This requires a shift in content strategy: from chasing traffic to delivering value in the most accessible format. If your content is the one AI selects to summarize, you gain authority, trust, and long-term visibility — even in a zero-click world.

In short, the future of SEO in India isn’t about who ranks #1, but who answers best.
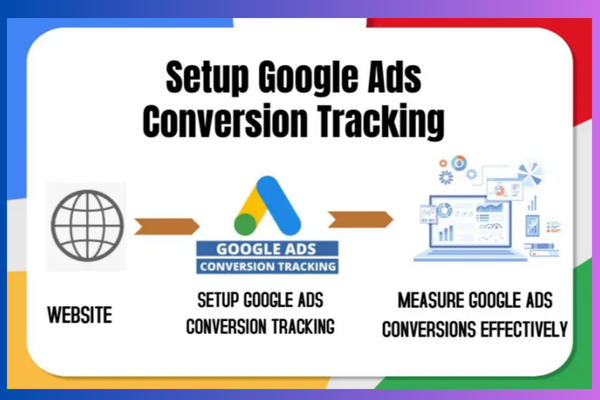

How to set up conversion value tracking?

Conversion value tracking in Google Ads allows advertisers to measure the monetary value of user actions on their websites, such as purchases, sign-ups, or lead submissions. Instead of just tracking the number of conversions, it helps businesses understand how much revenue each ad interaction generates. This is essential for evaluating return on ad spend (ROAS), optimizing bidding strategies like Maximize Conversion Value, and making better data-driven marketing decisions.

Whether you run an eCommerce store like Myntra or Zara, or you collect leads for a service business, setting up conversion value tracking allows you to assign a rupee value to the actions users take after clicking on your ads.

Here’s a step-by-step guide on how to set it up effectively.

Step 1: Define What a Conversion Is Worth

Before setting up anything in Google Ads, determine:

  • Which user actions count as conversions (e.g., purchase, form submit, sign-up)

  • How much each action is worth to your business

You have two options:

  1. Static Value: Every conversion has the same value (e.g., ₹500 per lead)

  2. Dynamic Value: The value depends on the actual transaction amount (e.g., ₹2,000 from a Zara purchase)

Step 2: Set Up a Conversion Action in Google Ads

  1. Sign in to your Google Ads account

  2. Click on Tools & Settings (top menu)

  3. Under Measurement, select Conversions

  4. Click the blue + New Conversion Action

  5. Choose Website as the source

  6. Enter your website domain and click Scan

  7. Choose the type of conversion: Purchase, Sign-up, Submit lead form, etc.

  8. Set up the conversion name (e.g., “Purchase – Zara”)

  9. Under Value, select:

    • “Use the same value for each conversion” for static value

    • “Use different values for each conversion” if you want to track revenue dynamically

  10. Choose a default currency (₹)

  11. Set the count:

    • “Every” for eCommerce

    • “One” for lead generation

  12. Choose your click-through conversion window (default is 30 days)

  13. Click Done, then Save and Continue

Step 3: Add the Conversion Tracking Tag to Your Website

You now need to install the global site tag and event snippet on your website.

Option A – Use Google Tag Manager (Recommended)

  1. Go to Google Tag Manager

  2. Create a new tag

  3. Select Tag Type: Google Ads Conversion Tracking

  4. Enter your Conversion ID and Conversion Label (found in Google Ads setup steps)

  5. For dynamic values, set up a variable that pulls transaction value from the purchase confirmation page (like {{Transaction Value}})

  6. Set a trigger for Page View – Thank You Page or Form Submission

  7. Save and publish the container

Option B – Install Tags Manually

  1. Copy the Global site tag and paste it into the <head> of every page of your website

  2. Copy the Event snippet and paste it just before the closing </body> tag on the specific conversion page (e.g., order confirmation or thank-you page)

  3. If using dynamic values, make sure the snippet is modified to pass the value dynamically using JavaScript or server-side data

Example for eCommerce using Zara:

html
<script>
gtag('event', 'conversion', {
'send_to': 'AW-123456789/XyzLabel',
'value': 2999.0,
'currency': 'INR',
'transaction_id': ''
});
</script>

Step 4: Verify That the Tag Is Working

Use Google Tag Assistant or the Google Ads Tag Diagnostics Tool to:

  • Confirm that the conversion tag is firing correctly

  • Ensure that values are being passed correctly (₹ value shows up in the conversion)

You can also use Google Analytics (GA4) to cross-check transactions and compare against Google Ads conversion reports.

Step 5: View Conversion Values in Your Google Ads Reports

Once conversions start coming in, go to:

  • Campaigns > Add Columns > Conversions

  • Add the columns: Conversion Value, Value/Conversion, and ROAS (Conv. value / cost)

These columns will show:

  • How much value your ads are generating

  • The average value per conversion

  • Return on ad spend (ROAS)

For example, if you spent ₹10,000 and generated ₹50,000 in conversion value from your Myntra campaign, your ROAS will show as 5.0.

Step 6: Use Smart Bidding With Conversion Value

Now that you have conversion value tracking set up, you can switch your bidding strategy to:

  • Maximize Conversion Value

  • Target ROAS (Return on Ad Spend)

Go to your campaign settings:

  • Click Bidding

  • Choose Maximize Conversion Value

  • Or set a Target ROAS, such as 400% (4x return)
    Google Ads will automatically optimize bids based on the value of each click.

Use Case Example: Zara India

Let’s say Zara is running Google Ads for its online store in India. Each item has a different price — dresses may cost ₹2,500 while handbags cost ₹5,000. Instead of assigning a fixed value per sale, Zara sets up dynamic conversion tracking to capture the actual revenue. They configure their eCommerce platform to pass the exact order value to the Google Ads conversion tag. Now, they can see exactly how much each campaign, ad group, or keyword contributes in rupees. With this data, they switch to Target ROAS bidding to prioritize high-revenue-generating ads and stop wasting money on low-performing segments.

Conclusion
Setting up conversion value tracking in Google Ads is crucial for understanding the real business impact of your campaigns. It allows you to measure revenue, calculate return on ad spend, and make smarter bidding and budget allocation decisions. Whether you’re using a static value or dynamic values through Google Tag Manager or manual code, tracking conversion value gives you full visibility into the effectiveness of your advertising. Brands like Zara, Myntra, or Skechers rely on this feature to run profitable, scalable campaigns that focus not just on clicks, but on actual revenue generated.

What is the difference between metrics and dimensions?

Introduction
In Google Ads and Google Analytics, two foundational concepts help advertisers interpret and optimize their campaigns: metrics and dimensions. These terms are frequently used in reporting, analysis, and performance evaluation. While they often appear side-by-side in reports, they serve very different functions. To make smart decisions in your ad strategy, it’s important to clearly understand how metrics and dimensions work and how they differ.

Definition of Dimensions
A dimension is a descriptive attribute or category of your data. It gives context to the performance numbers. Dimensions answer the question “what?” They describe the characteristics of your traffic or campaign components. For example, dimensions include campaign names, device types, locations, keywords, days of the week, time of day, and so on. They help you categorize and organize your data to better understand performance across different slices of your campaign.

Definition of Metrics
A metric is a quantitative measurement. Metrics answer the question “how much” or “how many.” They are numbers that represent how well your campaigns are performing. Metrics include values like clicks, impressions, conversions, click-through rate (CTR), cost, cost-per-click (CPC), conversion rate, and return on ad spend (ROAS). Metrics help you evaluate performance and compare results across different campaigns, ad groups, or keywords.

Real-World Example Using Zara
Let’s say Zara is analyzing the performance of a campaign promoting a new clothing line across India. They want to understand which cities are driving the most sales through mobile devices. In their report, they use the following dimensions: City (e.g., Delhi, Mumbai, Bangalore), Device type (e.g., Mobile, Desktop). The metrics they include are: Clicks, Impressions, CTR, Conversions, and Cost.

So the report might show something like this:

City: Delhi
Device: Mobile
Clicks: 1,500
Impressions: 30,000
CTR: 5%
Conversions: 180
Cost: ₹20,000

In this report, “City” and “Device” are the dimensions. They describe the data. “Clicks,” “Impressions,” “CTR,” “Conversions,” and “Cost” are the metrics. They measure the data. Dimensions categorize the performance. Metrics quantify it.

How Metrics and Dimensions Work Together in Reports
When you build reports in Google Ads using the Report Editor, dimensions are used to group your data and metrics are used to measure the performance within each group. For example, if you add “Campaign” as your dimension and “Clicks,” “Cost,” and “Conversions” as your metrics, you’ll be able to see how each campaign performed in terms of those numbers. You can also add filters, such as “Device = Mobile,” to focus on specific audience segments.

Use Case: Skechers Campaign
Suppose Skechers is running ads for its walking shoes and wants to evaluate how well their campaign is doing across different regions and times of day. They set up a report using the following dimensions: Region, Time of Day. Then they include metrics like Conversions, CTR, and Cost. This helps Skechers see which regions have the highest conversion rates and which times of day deliver the most clicks or the best cost efficiency. By segmenting data using dimensions and evaluating it with metrics, Skechers can optimize ad spend and campaign timing.

Key Differences Between Metrics and Dimensions
Dimensions describe your data. Metrics measure your data. Dimensions are labels like campaign name, device type, keyword, or location. Metrics are numerical results like how many clicks, how much cost, how many conversions. Dimensions categorize. Metrics quantify. Dimensions are typically text values or categories. Metrics are always numerical. Dimensions answer “what.” Metrics answer “how many” or “how much.” In reports, dimensions are usually rows, and metrics are columns with values. You use dimensions to break down performance, and metrics to evaluate that performance.

Why Understanding the Difference Matters in Google Ads
When building reports or optimizing performance, knowing what’s a dimension and what’s a metric helps you use tools like the Report Editor correctly. It allows you to group and filter data meaningfully. For example, you may want to evaluate CTR (a metric) by device type (a dimension), or see how cost per conversion (a metric) varies across locations (a dimension). This allows advertisers to uncover insights like which region is the most cost-efficient or which devices deliver the highest ROI. Without knowing the distinction, your reports may be misaligned or lack actionable depth.

Common Dimensions in Google Ads
Campaign
Ad group
Device
Keyword
Geographic location
Ad type
Placement
Audience segment
Date

Common Metrics in Google Ads
Clicks
Impressions
CTR (Click-through rate)
Conversions
Cost
CPC (Cost per click)
Conversion rate
ROAS (Return on ad spend)

Conclusion
Metrics and dimensions are two sides of the same coin in Google Ads reporting. While dimensions provide the structure and context for your data, metrics fill in the actual performance numbers. Together, they help you understand how well your campaigns are working and where you need to optimize. Brands like Zara, Myntra, or Skechers rely on this structure to evaluate campaign performance across regions, devices, keywords, and more. Mastering this distinction allows advertisers to build more insightful reports, take targeted actions, and improve the return on their ad investment.

Why AI Overviews Demand a Shift from Traffic to Conversion Metrics Now


Introduction

For decades, digital marketers and SEO professionals have lived and breathed one primary metric: website traffic. The assumption was straightforward — more visitors equaled more opportunities for engagement, leads, and sales. But with the rise of AI overviews and zero-click search experiences, that assumption no longer holds the same value. AI-generated overviews, such as those in Google’s Search Generative Experience (SGE), Microsoft’s Bing AI, and tools like ChatGPT, deliver synthesized answers directly in the search results. Users increasingly get what they need without clicking through to any site.

This change presents a challenge and an opportunity. While traffic to websites may decline, the importance of conversion metrics — actions that signify value, like sign-ups, downloads, purchases, or lead form completions — is growing rapidly. Businesses now need to shift focus from the volume of visitors to the quality of engagement and measurable outcomes.

In this article, we’ll explore:

  • How AI overviews are transforming search behavior
  • Why traditional SEO metrics are becoming less relevant
  • What new metrics matter most
  • How brands can adapt and thrive in this AI-first era
  • A real-world example illustrating this shift

What Are AI Overviews?

AI overviews are dynamically generated, concise answers to user queries, created by large language models (LLMs). Instead of simply indexing web pages and showing a list of links, AI overviews synthesize and summarize relevant information from multiple sources — sometimes even referencing them, but often without requiring the user to click through to any.

For example, when you search “best time to water tomato plants,” instead of a list of 10 blue links, you might see a short paragraph explaining the ideal time (early morning), with context about soil moisture, temperature, and plant health — all pulled together instantly.

Platforms incorporating AI overviews include:

  • Google SGE (Search Generative Experience)
  • Microsoft Bing Copilot
  • Perplexity.ai
  • ChatGPT with web browsing
  • Voice assistants like Alexa and Siri

This paradigm shift in search means that users are getting answers faster — but they are also bypassing websites more often.


Why Traffic Is No Longer the Ultimate Goal

For years, digital strategies centered around maximizing traffic. Marketers celebrated spikes in pageviews and sessions. But AI overviews change that dynamic in three key ways:

1. Zero-Click Searches Are Increasing

According to studies, over 50% of Google searches in recent years resulted in no click at all. With AI overviews, this trend is accelerating. Users get their answers at the top of the page and move on.

This means:

  • Fewer visits to websites
  • Less engagement with traditional landing pages
  • Less opportunity to monetize via ads or upsells

2. Exposure Happens Without Clicks

AI systems may still reference your brand or content in their overviews. This generates brand visibility but not necessarily traffic. You might be a trusted source that’s quoted, but you get no analytics credit unless a user clicks through.

This disconnect demands a new way to measure influence — beyond visits.

3. User Intent Has Evolved

AI has made it easier for users to be more specific in their queries. This means users further down the funnel are looking for direct, actionable answers. If your content solves their problem before they even click, your website needs to deliver even more value to encourage conversions.


The New North Star: Conversion Metrics

In an environment where visibility doesn’t always translate to visits, the focus should move toward conversion-focused outcomes. These metrics show real business impact, not just digital footprint.

Key conversion metrics include:

1. Lead Generation

Form submissions, newsletter sign-ups, quote requests — anything that captures user interest or contact information.

2. Sales and Purchases

For e-commerce or SaaS, this could be product purchases, free trial sign-ups, or paid subscriptions.

3. Click-to-Call or Appointment Booking

Especially for service-based or local businesses. A user who makes a call after seeing your business in an AI summary is more valuable than one who reads a blog and bounces.

4. Micro-Conversions

These are smaller actions indicating engagement, such as:

  • Downloading an ebook
  • Adding a product to a wishlist
  • Using a price calculator

5. Attribution Beyond the Click

New tools can track when a user saw your brand in an AI response and later visited via a different path (like direct or branded search). This type of multi-touch attribution is increasingly important.


Example: A Real-World Shift in Metrics — “GreenWise Energy Solutions”

Company Profile:
GreenWise Energy is a solar panel installation company with a blog and educational hub offering advice on green living, energy savings, and home efficiency.

Traditional SEO Strategy:
They focused on:

  • Ranking for “solar panel costs,” “reduce electric bill,” and “solar incentives 2025”
  • Driving traffic to articles and landing pages
  • Optimizing CTAs within blog posts

The Challenge:
After AI overviews became more common in Google and Bing, their blog traffic dropped by 30% in six months. However, when they looked closer, leads and booked consultations were steady — even increasing slightly.

Why?

Because users were still seeing GreenWise quoted in AI summaries:

“According to GreenWise Energy, average solar panel installation in 2025 costs between $12,000–$16,000 depending on region and roof type.”

This visibility, even without a click, reinforced their brand authority. Users remembered the name, and many later:

  • Googled “GreenWise Energy”
  • Visited directly
  • Booked consultations

New Strategy:
GreenWise updated its KPIs to focus on:

  • Branded search volume increases
  • Consultation bookings from direct traffic
  • Lead form submissions from unique, AI-optimized landing pages

They began creating AI-friendly content with:

  • Clear, concise answers in the first 100 words
  • Schema markup (FAQ, HowTo)
  • Strong brand reinforcement (name and contact details throughout)

As a result:

  • Traffic continued to decline slightly
  • But lead quality and conversion rates improved by 18%
  • Branded search queries grew by 22% over six months

How to Adapt Your Strategy for Conversion-Centric SEO

1. Redefine Success Metrics

Update reporting dashboards to focus on:

  • Cost per acquisition (CPA)
  • Lead quality scores
  • Funnel performance (visits to conversions)

2. Optimize for Featured Mentions

Craft content so that it’s likely to be quoted or summarized:

  • Use simple, clear sentences
  • Provide direct answers to common questions
  • Include statistics, definitions, and expert insights

3. Create Conversion-Focused Content Hubs

Move beyond blog articles. Build landing pages tailored to:

  • Customer pain points
  • Product comparisons
  • FAQs that double as lead generators

4. Use First-Party Data for Retargeting

If a user doesn’t click today, ensure they see your brand elsewhere:

  • Use social retargeting based on time spent on site
  • Build email lists through subtle micro-conversions (e.g., “Get this checklist”)

5. Track Brand Mentions in AI Summaries

Use tools (like Brand24, Mention, or SEO add-ons monitoring SGE) to track where your brand appears — even without clicks. This shows your share of voice in AI ecosystems.


Conclusion: From Attention to Action

The rise of AI overviews is not the end of SEO — but it’s the end of SEO as traffic acquisition only. Success in this new era is about action, not just attention.

Brands that pivot now to prioritize conversion metrics — like lead generation, purchases, and branded engagement — will thrive. This requires smarter content, better tracking, and a clear understanding that value isn’t just measured in pageviews anymore, but in how many users take the next step with your business.

As the web becomes more AI-driven and users become more answer-focused, marketers must evolve from chasing visits to engineering results. The earlier you make this shift, the more resilient your digital presence will be.


How to use the report editor in Google Ads?

Introduction
The Report Editor in Google Ads is a powerful, built-in tool that allows advertisers to create, customize, and analyze detailed reports using interactive tables, charts, and pivot tables. It offers more flexibility than standard reports and lets you explore your account’s performance in a visual, data-rich environment without needing to export data to external tools like Excel or Google Sheets.

Whether you want to analyze keywords, ad groups, campaign metrics, conversion data, audience performance, or geographical insights, the Report Editor gives you the tools to build personalized reports that suit your unique needs.

Here’s a complete step-by-step guide on how to use the Report Editor effectively.

Step 1: Accessing the Report Editor

  1. Sign in to your Google Ads account at https://ads.google.com.

  2. Click on the “Reports” icon in the top right corner of your dashboard (it looks like a bar chart).

  3. Select “Report Editor” from the drop-down menu.

  4. You’ll be taken to the Report Editor interface, where you can begin building a report from scratch or use a predefined template.

Step 2: Choosing the Report Type

In Report Editor, you can build various types of visual reports:

  • Table (default): Displays data in a spreadsheet-like layout

  • Bar chart

  • Line chart

  • Pie chart

  • Scatter plot

You can switch between these formats depending on how you want to view and analyze your data.

Step 3: Drag and Drop Metrics and Dimensions

  1. On the left side, you’ll see two panels: Dimensions and Metrics.

  2. Dimensions refer to data categories like:

    • Campaign

    • Ad group

    • Device

    • Geographic location

    • Keyword

    • Day of the week

  3. Metrics refer to performance data such as:

    • Clicks

    • Impressions

    • Conversions

    • Cost

    • Click-through rate (CTR)

    • Cost per click (CPC)

    • Conversion rate

To build a report:

  • Drag a dimension (e.g., Campaign) to the rows section

  • Drag a metric (e.g., Clicks, Conversions) to the values section

The report will auto-generate in real time, showing your selected data.

Step 4: Apply Filters to Refine Your Data

You can filter your data to show only specific insights:

  • Click on the “Filter” button.

  • Choose the dimension or metric you want to filter by (e.g., Device = Mobile).

  • Add multiple filters to drill down deeper.

This helps in isolating performance for a specific campaign, date range, audience segment, keyword, etc.

Step 5: Use Segments and Sorting

You can segment your data by additional variables such as:

  • Device

  • Day of the week

  • Network (Search vs. Display)

  • Top vs. Other placements

Segmentation helps uncover more granular trends. For example, you can compare performance between desktop and mobile traffic for the same campaign.

You can also sort data by any metric. For instance, to find the ad groups with the highest conversion rate, simply click the “Conversion Rate” column header to sort in descending order.

Step 6: Change the Time Frame

Use the date selector at the top right of the page to choose a specific date range:

  • Today

  • Yesterday

  • Last 7 days

  • This month

  • Custom date range

You can also compare date ranges (e.g., last 7 days vs. previous 7 days) to analyze trends and performance shifts over time.

Step 7: Create Charts for Visualization

To visualize your data:

  • Click on the “Chart” icon at the top.

  • Choose the type of chart you want: Line, Bar, Pie, or Scatter.

  • Customize the x-axis and y-axis by dragging dimensions and metrics into the respective fields.

Visualizing trends makes it easier to spot patterns and insights at a glance.

Step 8: Save and Schedule Reports

Once your report is ready:

  • Click “Save as” in the top right corner.

  • Give your report a name, e.g., “Weekly Campaign Performance.”

  • You can access this saved report anytime from the Reports > Reports section.

To schedule email delivery:

  • Click “Schedule Email”

  • Choose the recipients, email frequency (daily, weekly, monthly), and format (CSV, Excel, PDF)

  • Google Ads will send this report automatically to your team or client as per the schedule

Step 9: Share the Report

You can share the report directly with team members by clicking the “Download” icon to export it or using the “Share” icon to give access within the Google Ads interface.

Step 10: Use Templates for Fast Setup

Google Ads also offers pre-built report templates that you can customize, such as:

  • Device Performance Report

  • Campaign Type Summary

  • Keywords Performance

  • Ad Group Conversions by Day

You can access templates by clicking the “+ Report” button and choosing from the available options.

Use Case Example: Zara

Let’s say Zara is running multiple ad campaigns for summer collections across India. Their marketing team wants to see which cities are generating the most sales conversions through mobile devices.

Using the Report Editor, Zara’s team can:

  • Drag “Campaign” and “City” into rows

  • Drag “Conversions”, “CTR”, and “Cost” into metrics

  • Apply a filter for “Device = Mobile”

  • Set a custom date range for the last 30 days

  • Sort by Conversions in descending order

  • Use a bar chart to visualize which cities performed best

This kind of report helps Zara identify which regions need more budget or which ones to optimize for.

Conclusion

The Report Editor in Google Ads is a powerful tool that allows advertisers to dive deep into performance data without using external spreadsheets. It’s fully customizable, supports visual reporting, and helps uncover meaningful insights across campaigns, devices, locations, and more. With features like drag-and-drop fields, advanced filtering, segmentation, charting, scheduling, and sharing, it becomes an essential tool for brands like Zara, Myntra, or Skechers who want to make informed decisions based on real-time, actionable data. Whether you’re a beginner or an advanced user, mastering the Report Editor can dramatically improve how you analyze and optimize your advertising strategy.

What is position-based attribution?

Introduction
Position-based attribution, also known as the U-shaped attribution model, is a method used in Google Ads to distribute conversion credit unevenly across the different touchpoints a customer interacts with before converting. This model gives the most credit to the first and last interactions, while splitting the remaining credit equally among the middle interactions. The idea behind this model is that the first click plays a vital role in introducing a customer to your business, and the last click plays an equally crucial role in closing the deal. The middle interactions, while important, receive less emphasis.

This model is ideal for advertisers who believe that both initial awareness and final conversion-driving actions are more influential than the research or consideration steps in between. It’s a great way to give credit to the ads that start and finish a customer journey, especially for businesses using full-funnel strategies that combine brand awareness with performance marketing.

Understanding Position-Based Attribution
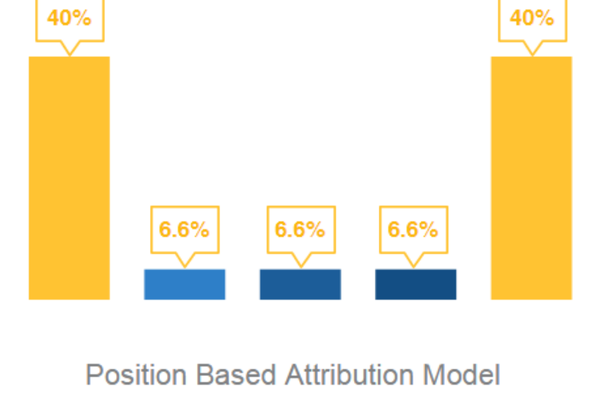
In a typical position-based attribution model, the first click gets 40% of the credit, the last click gets 40%, and the remaining 20% is distributed equally among any middle interactions.

This distribution reflects a strategic balance between brand-building (the first interaction) and conversion-driving performance (the last interaction), while still acknowledging the role of the middle interactions.

For example, if a user clicks on 4 ads before making a purchase:

  • The first interaction gets 40%

  • The last interaction gets 40%

  • The 2 middle interactions each get 10%

Example: Myntra’s Position-Based Path

Let’s say a customer is shopping for festive clothing and follows this journey:

  1. Watches a YouTube ad from Myntra showing a new festive collection (First click)

  2. Clicks on a Search ad for “latest kurta sets”

  3. Clicks on a Display remarketing ad

  4. Clicks on a Shopping ad for a specific kurta and makes the purchase (Last click)

With position-based attribution:

  • YouTube ad (1st click) gets 40% credit

  • Shopping ad (last click) gets 40% credit

  • Search and Display ads (middle interactions) each get 10%

This model gives Myntra useful insights. It shows that the YouTube ad was very effective in attracting the customer, while the Shopping ad sealed the deal. The Search and Display campaigns played supporting roles.

Benefits of Position-Based Attribution

1. Rewards Both Awareness and Conversion Efforts
This model acknowledges the importance of the first touchpoint, which introduces the customer to your brand, and the last one, which leads to a sale. It’s ideal for advertisers who invest in both brand awareness and performance.

2. Balanced and Strategic
Unlike last-click, which only credits the final ad, or linear, which spreads credit equally, position-based attribution strategically emphasizes key moments: introduction and conversion.

3. Great for Full-Funnel Campaigns
If you use a mix of YouTube (top-of-funnel), Search (mid-funnel), and Shopping (bottom-funnel) campaigns, this model highlights how top and bottom campaigns are crucial, while still recognizing middle campaigns.

4. Ideal for Mid-Length Customer Journeys
If your typical customer interacts with 3–5 ads before converting, this model fits well. It captures the full path without overcomplicating the weighting.

5. Encourages Investment in High-Impact Ads
By revealing the value of both early-stage and late-stage campaigns, advertisers can allocate budgets more effectively to the touchpoints that matter most.

Limitations of Position-Based Attribution

1. Underestimates Mid-Funnel Touchpoints
The model assumes middle interactions are less important, which might not always be true. Sometimes, a mid-funnel ad provides key information that helps the user decide.

2. Arbitrary Credit Distribution
The 40%-20%-40% split is a general assumption. It might not reflect the real influence of each step in every user journey. Some businesses may need more flexible modeling.

3. Doesn’t Adapt to User Behavior Automatically
Unlike Data-Driven Attribution (DDA), which uses machine learning, position-based attribution doesn’t adjust based on actual performance. It’s fixed and based on rules.

4. Less Suitable for Extremely Short or Long Journeys
If a customer clicks only once or twice, this model may not apply effectively. Similarly, for long B2B or research-heavy buying cycles, more nuanced models like DDA may be better.

Example: Skechers Campaign

Imagine Skechers is promoting new performance walking shoes. A potential buyer:

  1. Clicks a YouTube ad showing a walking shoe lifestyle video (First click)

  2. Later clicks a Search ad after Googling “best walking shoes for daily use”

  3. Finally clicks on a Shopping ad showing a discounted pair and makes a purchase (Last click)

Here’s how position-based attribution would assign credit:

  • YouTube ad (First click): 40%

  • Search ad (Middle interaction): 20%

  • Shopping ad (Last click): 40%

This model shows Skechers that both the initial video campaign and the Shopping ad played major roles in the purchase, while the Search ad helped the user transition between research and decision.

When to Use Position-Based Attribution

  • When your business focuses heavily on both brand awareness and conversion ads

  • If you want to measure first and last touchpoints more seriously

  • When your customer journeys typically involve 3 to 5 steps

  • If you’re running cross-channel campaigns (like YouTube + Search + Shopping)

  • When you need a model that’s more advanced than last-click but simpler than DDA

How to Set Up Position-Based Attribution in Google Ads

  1. Log in to your Google Ads account

  2. Click Tools & Settings > Measurement > Conversions

  3. Select the conversion action you want to edit

  4. Click Edit settings

  5. Under Attribution Model, choose Position-Based

  6. Click Save

Once applied, Google Ads will use this model to report and optimize campaign performance accordingly.

Comparison with Other Attribution Models

  • First Click: Gives all credit to the first interaction

  • Last Click: Gives all credit to the last interaction

  • Linear: Gives equal credit to all touchpoints

  • Time Decay: Gives more credit to touchpoints closer to conversion

  • Data-Driven: Uses AI to assign credit based on actual behavior and impact

  • Position-Based: Gives 40% to the first and last, and splits 20% across the middle

Each model serves a specific goal. Position-based is ideal when you want to acknowledge both entry and exit points in the customer journey without complex algorithms.

Conclusion

Position-based attribution is a powerful and practical model in Google Ads that strategically distributes credit across a user’s conversion path. By giving 40% credit to both the first and last interactions, and the remaining 20% to middle interactions, it allows businesses to value both awareness and performance efforts. Brands like Myntra and Skechers can use this model to ensure their YouTube, Search, and Shopping campaigns are appropriately recognized for starting and finishing the customer journey. While not as sophisticated as data-driven attribution, position-based attribution offers a smart middle-ground for advertisers who want clarity, fairness, and better optimization insights for multi-touch advertising strategies.

What is time-decay attribution?

Introduction
In the digital marketing landscape, understanding how conversions happen is vital for making smart decisions. Attribution models help advertisers assign credit to different ad interactions a customer has before completing a conversion, like making a purchase or signing up. One such model is the Time-Decay Attribution model in Google Ads.

Time-decay attribution gives more credit to the interactions that happened closer to the conversion and less credit to earlier interactions. This model is especially useful for businesses where the final decision-making steps are more influential than the initial touchpoints. It recognizes that the more recent an interaction, the more likely it influenced the user’s final action.

Time-decay is a smart alternative for advertisers who believe that not all clicks are equally important, and that the timing of engagement matters. It works well for campaigns with short sales cycles, remarketing strategies, and last-minute decision-making processes.

Understanding Time-Decay Attribution
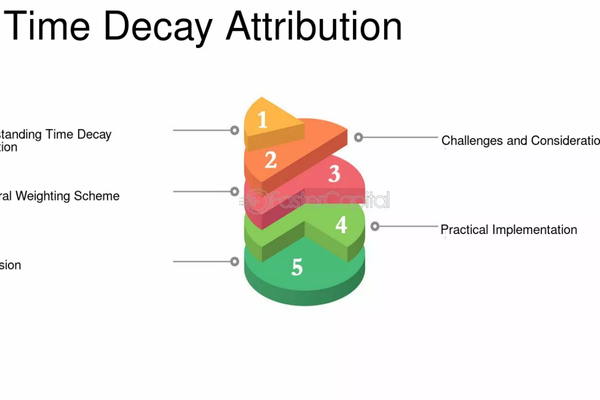
Unlike linear attribution, which assigns equal credit to all touchpoints, time-decay attribution uses a weighted model. It gives progressively higher credit to more recent ad interactions and lower credit to earlier ones.

Google Ads applies a 7-day half-life in time-decay attribution. This means that an interaction that occurred 7 days before a conversion gets half as much credit as an interaction that happened 1 day before. If an interaction happened 14 days earlier, it would get just one-quarter of the credit compared to the most recent click.

This model assumes that the closer the click to the conversion, the stronger its influence on the final decision.

Example: Myntra Time-Decay Journey
Let’s say a customer is shopping for casual wear on Myntra and follows this path:

  1. Clicks a YouTube video ad for “Myntra Casual Summer Looks” – 15 days before the purchase

  2. Searches “Myntra dresses for women” and clicks a Search ad – 10 days before

  3. Clicks a Display remarketing ad – 3 days before

  4. Clicks on a Shopping ad and makes a purchase – same day

In time-decay attribution, Google would assign more credit to the Shopping and Display ads because they occurred closer to the conversion. The YouTube ad, being the oldest, would get the least credit. The distribution might look something like this (simplified):

  • YouTube ad: 10%

  • Search ad: 20%

  • Display ad: 30%

  • Shopping ad: 40%

This model reflects that while the earlier ads introduced and built interest, the more recent ads pushed the user toward final action.

Benefits of Time-Decay Attribution

1. Prioritizes Recent Engagements
Time-decay is ideal for businesses that believe the last few steps are the most crucial in closing sales. It helps you recognize and support those final pushes that lead to conversions.

2. Supports Remarketing Campaigns
Remarketing ads, which are often shown to users who’ve already visited your site, tend to be closer to the decision-making moment. Time-decay helps give them proper credit for their role in sealing the deal.

3. Great for Short Sales Cycles
If your products or services involve fast decisions — like fashion, travel deals, or local services — this model helps focus on the most time-sensitive interactions.

4. Useful for Flash Sales and Limited Offers
When running time-sensitive promotions or flash sales, time-decay attribution ensures your most recent ads (which highlight the offer) are given more importance than early exposure.

5. Helps Optimize Real-Time Campaigns
Because the model emphasizes current interactions, it guides marketers to improve what’s working now instead of overvaluing outdated clicks.

Limitations of Time-Decay Attribution

1. Undervalues Brand Awareness Campaigns
Early touchpoints like YouTube, Display, or influencer campaigns, which introduce your brand to the user, may get very little credit. This can lead to underinvestment in essential awareness-building strategies.

2. May Misrepresent the Full Journey
If your product requires a long consideration phase (such as electronics or high-end fashion), time-decay might overly reward bottom-funnel actions and ignore the research phase.

3. Doesn’t Account for Quality of Engagement
This model doesn’t differentiate between a brief accidental click and a highly engaged session—it only looks at timing. A recent, low-quality click could get more credit than a strong earlier one.

4. Less Ideal for Long Sales Cycles
In industries like real estate, B2B software, or luxury goods, where users research for weeks or months, this model may misrepresent the importance of early ads.

Example: Skechers Time-Decay Strategy
Let’s say a user is looking to buy Skechers walking shoes. Here’s how their journey might unfold:

  1. Sees a Display ad 12 days before the purchase

  2. Watches a YouTube product review ad 8 days before

  3. Clicks a Search ad 4 days before

  4. Finally clicks a Shopping ad and buys on the same day

Under time-decay attribution, the Shopping ad (being the final touchpoint) would receive the most credit. The Search ad would get significant credit as well. The YouTube and Display ads would get some credit, but less because they occurred earlier.

This shows Skechers how the last few interactions were more decisive in converting the user. It also helps them focus budgets on high-intent platforms while still recognizing the awareness-driven efforts.

When to Use Time-Decay Attribution

  • When your business has short buying cycles

  • If you’re running flash sales, holiday offers, or urgency-driven promotions

  • When you heavily rely on remarketing or last-click channels like Shopping and Display

  • If your goal is to optimize for immediate performance

  • When you want to focus on high-intent moments closer to the point of sale

How to Set Up Time-Decay Attribution in Google Ads

  1. Sign in to your Google Ads account

  2. Go to Tools & Settings > Measurement > Conversions

  3. Choose a conversion action (like Purchases, Leads, or Sign-ups)

  4. Click Edit Settings

  5. Under Attribution Model, select Time-Decay

  6. Click Save

Once enabled, your conversion data and Smart Bidding (if active) will begin using this model to evaluate performance and optimize bidding.

Comparison with Other Attribution Models

  • Last-click attribution gives 100% credit to the final click

  • First-click attribution gives full credit to the first touchpoint

  • Linear attribution divides credit equally across all interactions

  • Position-based attribution gives 40% to the first and last clicks and 20% to middle ones

  • Data-driven attribution uses AI to assign credit based on actual conversion behavior

Time-decay is a middle-ground model between linear and last-click. It values the path to conversion but puts emphasis on what happens closer to the finish line.

Conclusion

Time-decay attribution is a smart model in Google Ads that gives more credit to ad interactions closer to the time of conversion. It’s perfect for businesses where recent ads—like remarketing, Shopping, and branded Search—play a critical role in driving sales. Brands like Myntra and Skechers can benefit from this model when running fast-moving campaigns that rely on timely engagement. While it may not fully capture the value of early awareness-building efforts, it’s a powerful tool for short-cycle conversions, performance marketing, and optimizing real-time campaigns. If your business prioritizes timing and final decision points, time-decay attribution offers a flexible and actionable way to measure success.

What is linear attribution?

Introduction
In digital marketing, it is essential to understand the customer journey and identify which marketing efforts are contributing to conversions. Attribution models help marketers and advertisers assign credit to various touchpoints in that journey. Google Ads offers several types of attribution models to evaluate performance across campaigns. Among these, Linear Attribution is one of the most balanced and straightforward models. It evenly distributes conversion credit across all touchpoints a customer interacts with before converting, rather than favoring the first or last click.

Linear attribution is particularly useful for businesses with multi-channel or full-funnel marketing strategies. It ensures that every ad, keyword, and campaign that played a role in guiding the user towards the final action receives fair recognition. By treating each step as equally important, advertisers can get a clearer understanding of how different ads interact and influence customer behavior.

Understanding Linear Attribution
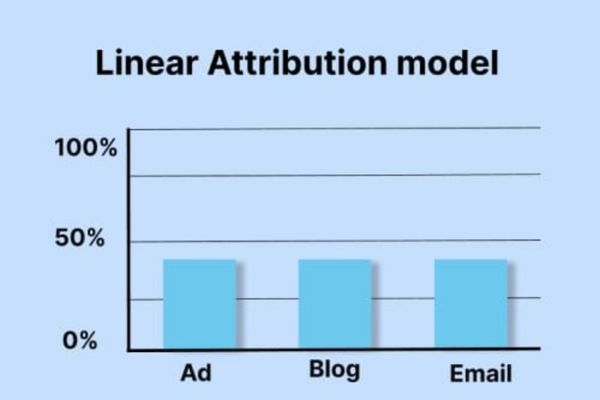
The linear attribution model is based on the principle of equal contribution. If a user clicks on four different ads before converting, each ad interaction is assigned 25% of the conversion value. This method assumes that all interactions had an equal influence on the customer’s decision to convert.

This is different from models like Last Click Attribution (where 100% of the credit goes to the last interaction) or First Click Attribution (where all credit goes to the first touchpoint). Linear attribution spreads credit across the full conversion path, making it more inclusive and suitable for understanding the overall effectiveness of your advertising efforts.

Example: Myntra’s Customer Journey
Imagine a user looking to buy an outfit for an upcoming festival. Their journey goes like this:

  1. They watch a YouTube video ad from Myntra showcasing festive fashion trends.

  2. Later, they search “best ethnic dresses” and click a Search ad from Myntra.

  3. A day later, they see a Display ad offering a 20% discount on dresses and click it.

  4. Finally, they click on a Shopping ad for a specific product and complete the purchase.

Under the linear attribution model, each of these four interactions would get 25% of the conversion credit. This means Myntra can evaluate how YouTube ads (which may have started the customer journey), Search ads (which provided more intent-driven engagement), Display ads (which encouraged return visits), and Shopping ads (which closed the sale) all played equally meaningful roles in converting the customer.

How to Set Up Linear Attribution in Google Ads
To implement linear attribution in your Google Ads account:

  1. Sign in to your Google Ads account.

  2. Click on Tools & Settings (the wrench icon in the top right).

  3. Under “Measurement,” click on Conversions.

  4. Select the conversion action you want to edit.

  5. Click Edit Settings.

  6. Scroll to the Attribution model section and select Linear.

  7. Save your changes.

Once set, your reporting and Smart Bidding (if used) will begin optimizing based on linear attribution data, and each campaign or ad involved in the path to conversion will reflect its fair share of credit.

Benefits of Linear Attribution

1. Balanced View of the Conversion Path
Linear attribution provides a more holistic view of your marketing performance. It gives equal credit to each step, allowing advertisers to see the value of both upper-funnel and lower-funnel activities. This is especially important when users interact with multiple ad formats and keywords before converting.

2. Encourages Investment in Top and Middle Funnel Campaigns
Unlike last-click models that reward only closing ads, linear attribution highlights the role of brand awareness and consideration-stage ads. This allows advertisers to justify budget allocation to YouTube, Display, and early-stage search campaigns that may not directly drive immediate conversions but contribute to eventual sales.

3. Simple to Understand and Implement
Linear attribution is straightforward. There are no complex algorithms or machine learning involved, which makes it easier for small businesses and new advertisers to grasp and implement. This simplicity also makes performance reports easier to interpret.

4. Reduces Optimization Bias
When advertisers rely solely on last-click attribution, they may undervalue or turn off campaigns that actually help drive conversions indirectly. Linear attribution helps reduce this bias by giving recognition to all influential touchpoints.

5. Works Well with Consistent Conversion Paths
If users typically engage with your ads in predictable, multi-step journeys, linear attribution ensures fair representation of each touchpoint without needing advanced modeling.

Limitations of Linear Attribution

1. Assumes All Touchpoints Are Equal
In reality, not all touchpoints have the same impact. Some interactions may be far more persuasive or influential than others. Linear attribution doesn’t distinguish between a casual initial view and a decisive product click, which can skew optimization if not considered.

2. May Not Be Suitable for Short Conversion Paths
If your customer journey is usually one or two steps, the benefits of using linear attribution diminish. In such cases, a model like last-click or first-click might be more useful and practical.

3. Lacks Precision Compared to Data-Driven Attribution
Data-driven attribution uses machine learning to understand which touchpoints truly drive results, assigning credit proportionally. Linear attribution, while fair, does not reflect actual user behavior or outcomes. As a result, it may not provide as precise guidance for automated bidding or campaign optimization.

4. Doesn’t Account for Time or Position in the Journey
Linear attribution treats all clicks the same regardless of when they happened or where they fall in the conversion path. A click that occurred two weeks before the sale is given the same value as one that happened just seconds before.

Example: Skechers Multi-Touch Marketing
Consider Skechers, a global footwear brand promoting a new line of walking shoes. A user sees a Display ad on a fitness website, clicks it, and browses products. A few days later, they watch a YouTube ad with a product demo. Later, they click a Search ad while looking for “lightweight Skechers shoes.” Finally, they click a Shopping ad and make a purchase.

Using the linear attribution model, each of these four touchpoints gets 25% of the conversion credit. Without this model, Skechers might ignore the Display or YouTube campaigns if they used last-click attribution, missing the opportunity to optimize their top-funnel strategy.

When to Use Linear Attribution
Linear attribution is a good fit for businesses with the following characteristics:

  • Running multi-channel marketing strategies involving awareness, consideration, and conversion campaigns

  • Wanting a simple and balanced approach without needing advanced algorithms

  • Interested in seeing how various campaigns work together instead of focusing on just one type

  • Managing campaigns with relatively predictable customer journeys involving multiple interactions

If your campaigns involve YouTube, Display, Shopping, and Search in combination, and your customers usually interact with more than one ad before converting, linear attribution offers a well-rounded performance view.

Comparison with Other Attribution Models

  • First Click Attribution credits only the first interaction

  • Last Click Attribution credits only the final interaction

  • Time Decay Attribution gives more credit to interactions that happened closer to the conversion

  • Position-Based Attribution splits credit heavily between the first and last touchpoints, often in a 40%-20%-40% format

  • Data-Driven Attribution uses machine learning to assign credit based on the real influence of each interaction

Compared to these, linear attribution is the most evenly distributed and unbiased model. It may not reflect true influence like data-driven attribution but serves as a fair and accessible alternative for advertisers without advanced resources.

Conclusion
Linear attribution in Google Ads offers a clear, fair, and simple way to measure the performance of all touchpoints in a user’s journey. By dividing conversion credit equally among all ad interactions, it ensures that both top-funnel and bottom-funnel campaigns are acknowledged for their role in driving conversions. Brands like Myntra and Skechers, which rely on multi-channel advertising, benefit from this model as it highlights the interconnected nature of customer interactions.

How to Become a Digital Marketing Specialist

Digital marketing is one of the fastest-growing fields today. Many people are interested in building a career in digital marketing, and becoming a digital...

What is SMM in Digital Marketing

SMM, or Social Media Marketing, is one of the most important parts of digital marketing. In simple words, SMM is the process of using...

What is Google Analytics in Digital Marketing

Google Analytics is one of the most important tools in digital marketing. It helps businesses understand how people interact with their websites and online...

What is Google AdWords in Digital Marketing

Google AdWords is one of the most important tools in digital marketing. Many businesses use AdWords to reach their target audience online and increase...

What Is CPM in Digital Marketing

In digital marketing, understanding how your ads are priced and measured is very important. Different advertising models help marketers track performance and control spending....